We are not into running after trends, nor at making it beautiful per se. We make it solid so it holds up for years.
Liquid is a creative studio dedicated to pursuing excellence and integrity in design. We engage in the fields of interactive design, branding, advertising and boast an extensive specialty in designing complex user experiences.
We practice our work meticulously, and are committed to a professional conduct, level of service and a can do attitude in all our work. We embrace all challenges big or small.Established 2009
Our
Approach.
Design is a process of discovery, hence we try again and again (and again) until the result is satisfactory. We believe in our ability to sift the chaff from the stone and find meaning and joy in creating things of functional beauty.
Selected
clients.


Contact
Us.
-
Email us
-
Call us


Details.
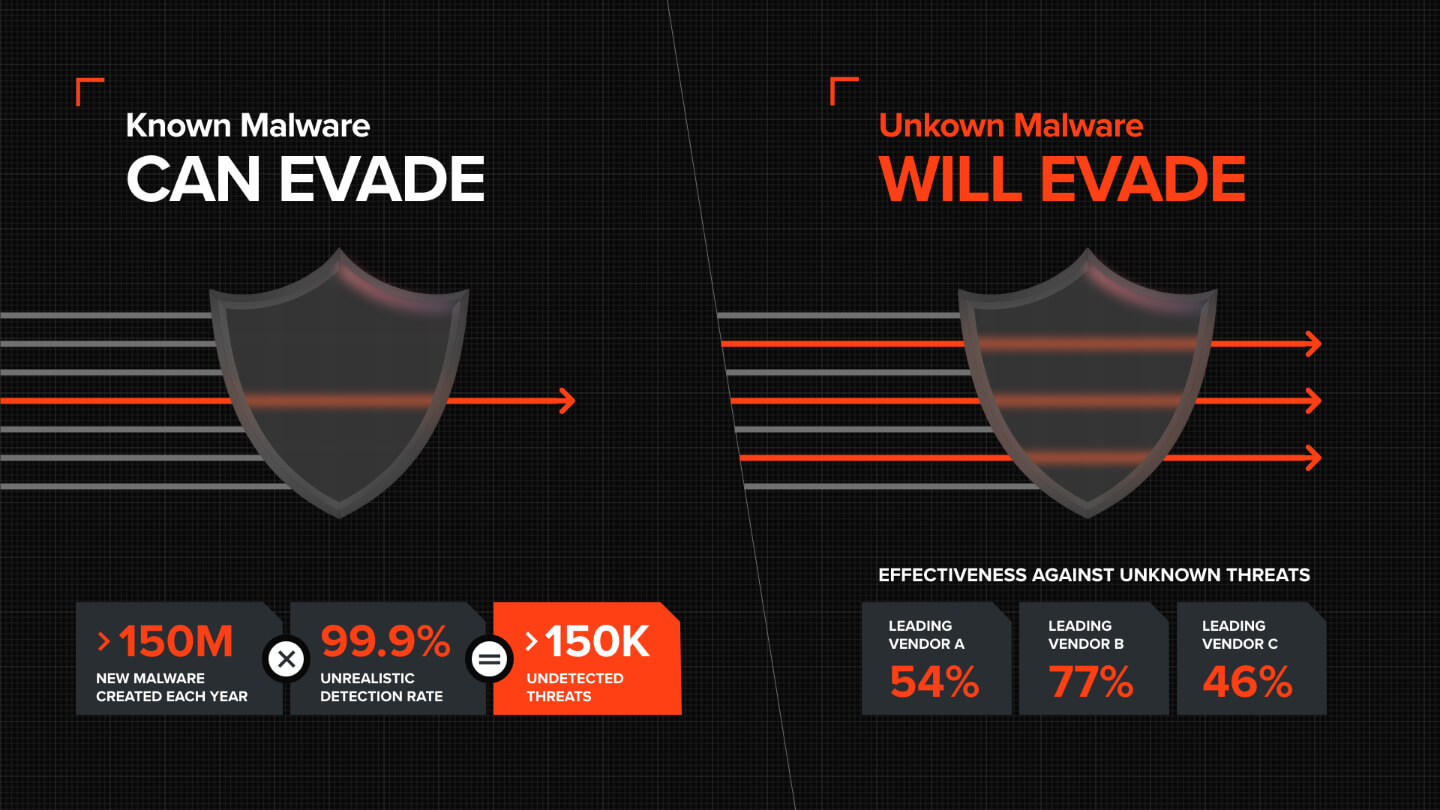
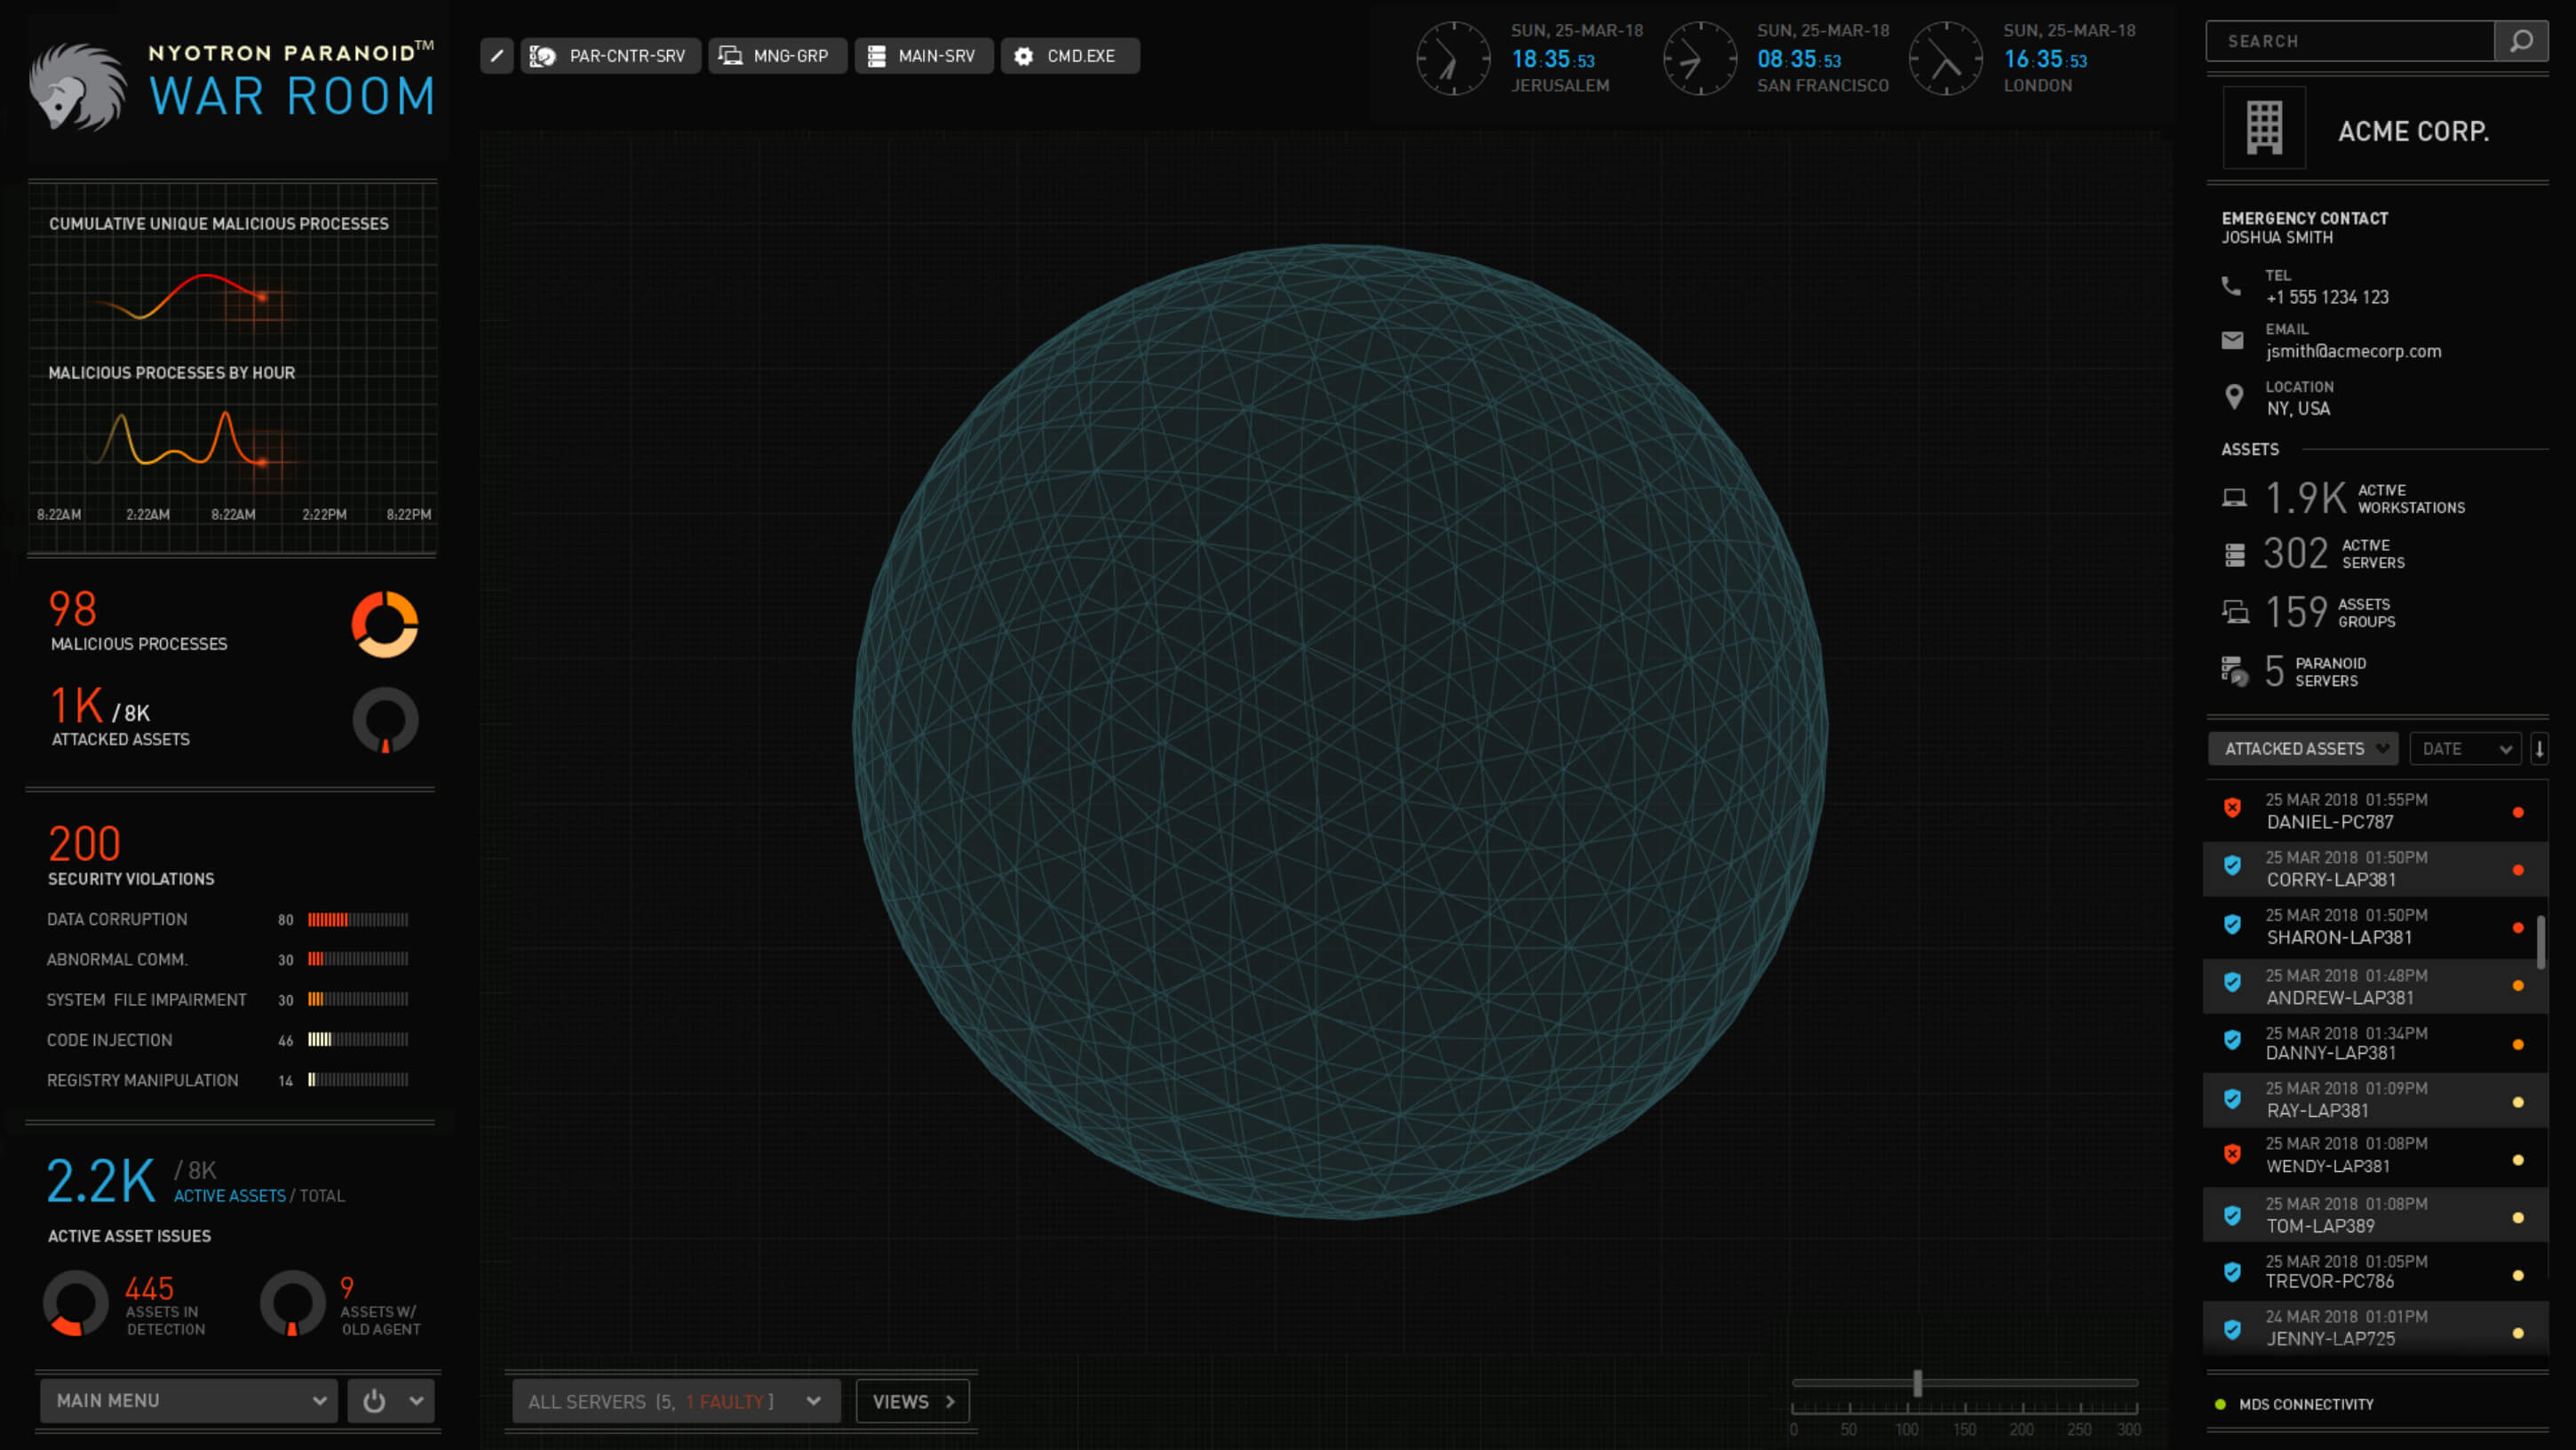
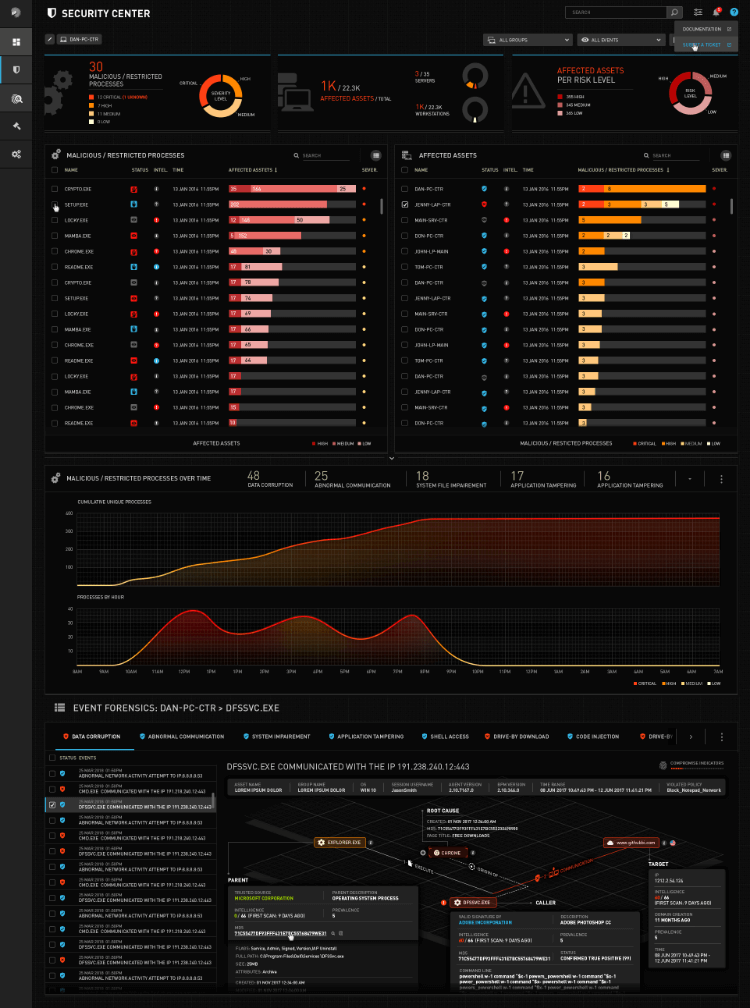
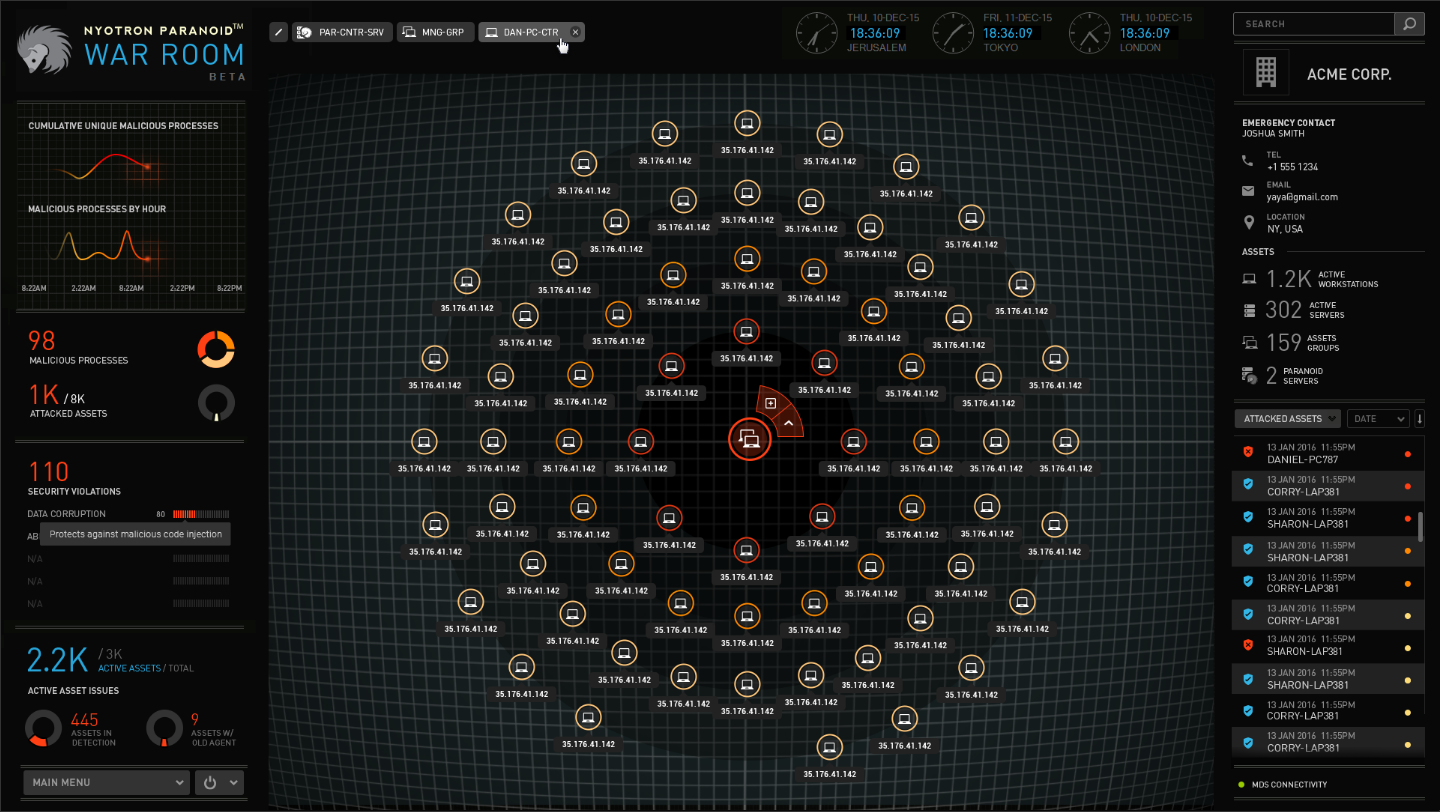
Nyotron develops ‘Paranoid’ - the first-ever OS-Centric Positive Security system. A key feature to Paranoid is the War Room which provides in-depth details about an attack as it happens. We were commissioned to vastly improved the Nyotron War Room while leveraging its look and feel to all of Nyotron products.

A state of the art security coupled with a striking visual experience. ‘Paranoid’ is the last line of defence.
Look and feel are crucial
There is a war going on, and ‘Paranoid’ is the last line of defence. Externalising the sophistication of the product helps to relieve the customer’s anxiety and build trust
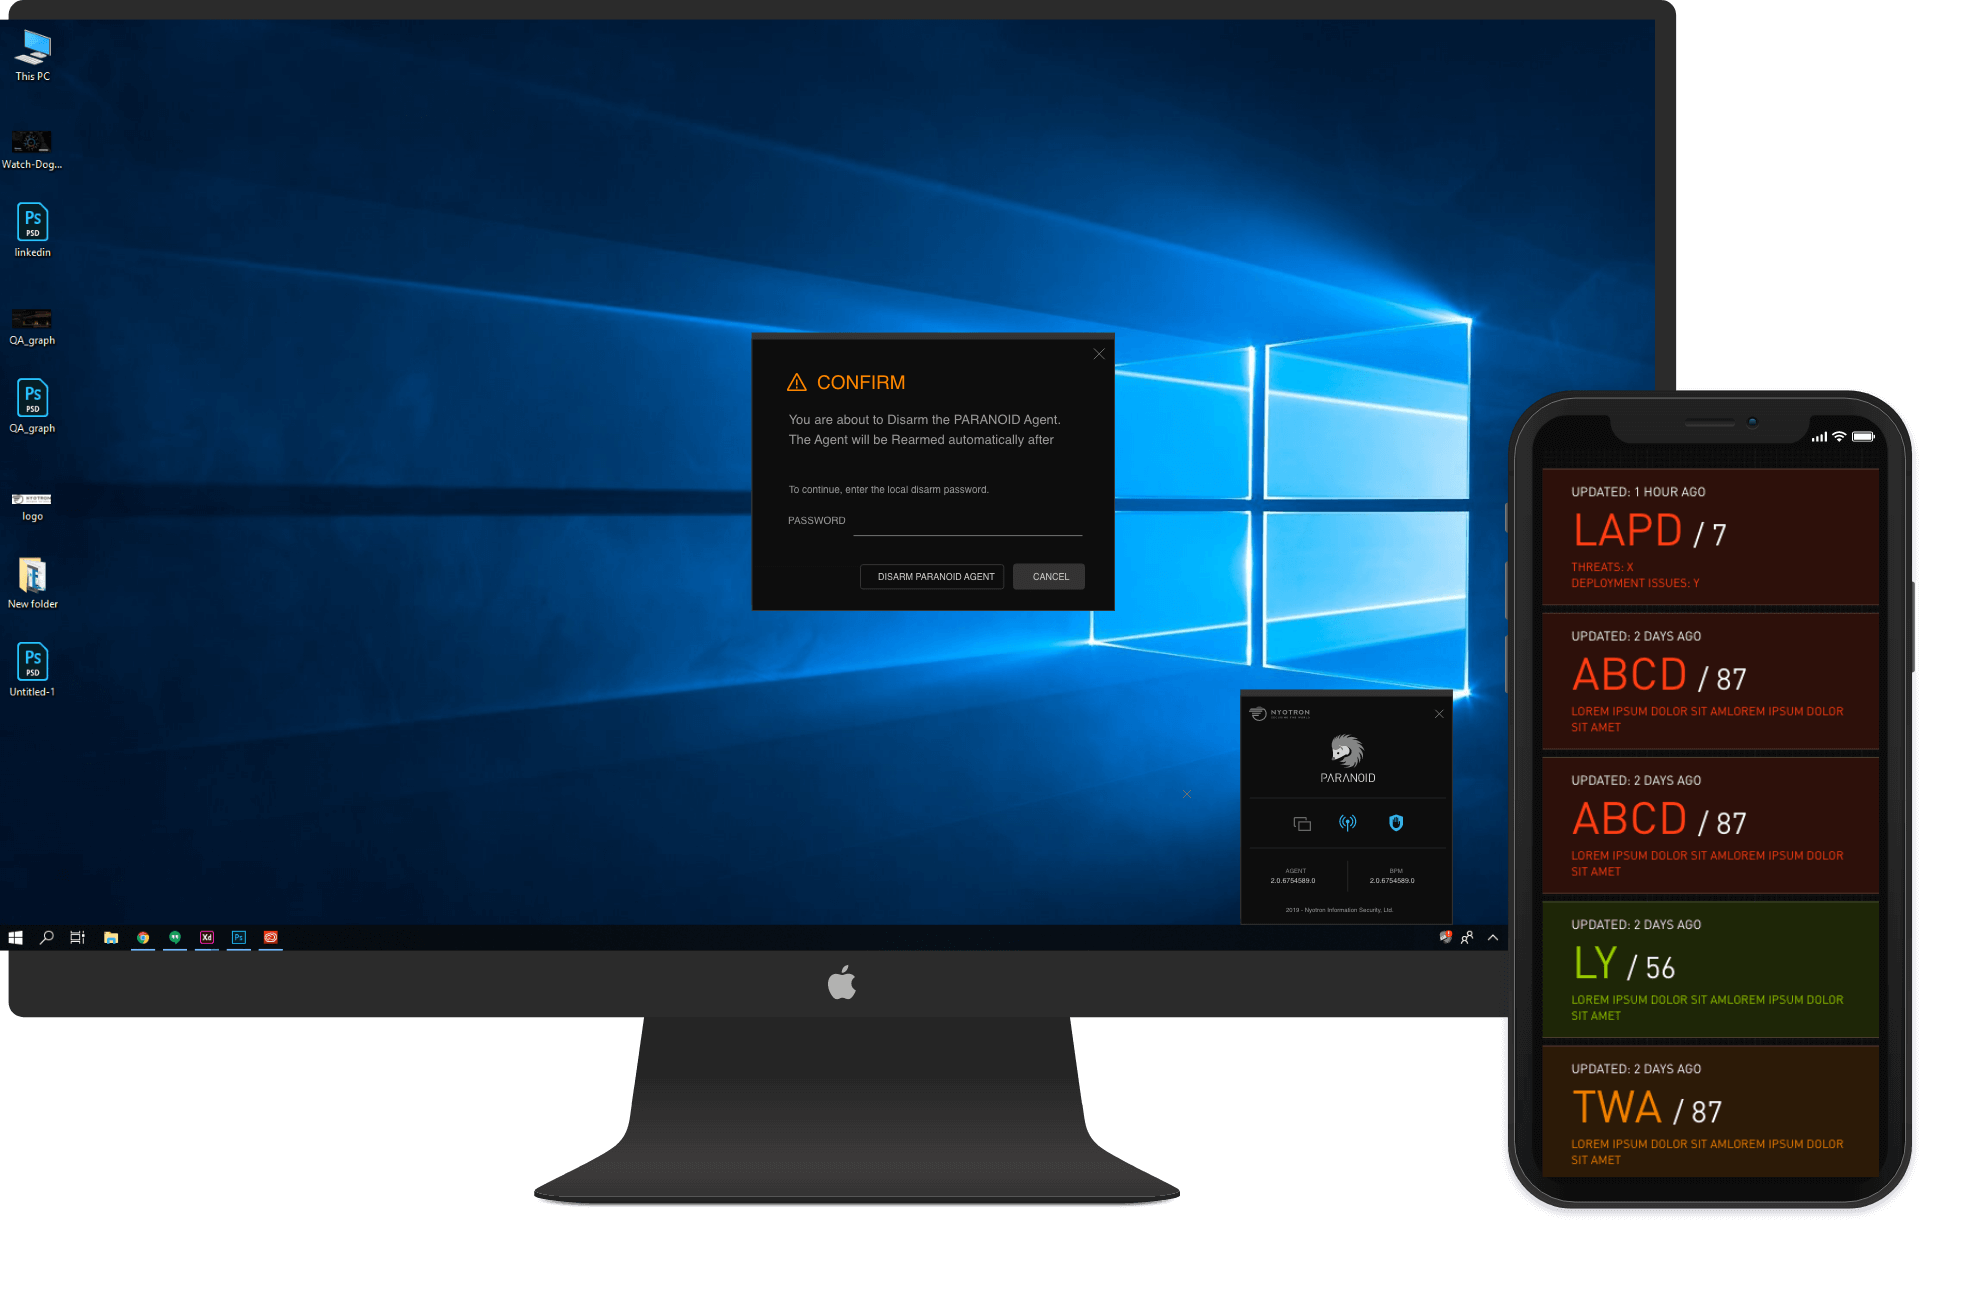
This is a tool, not a game
The users of the product are professional data analysts. They need a tool that is sturdy, understandable and easy to navigate.
From concept to viability
The War Room was a proof of concept. We turned it to a viable product.
When we arrived at the scene, Nyotron War Room was a neat concept. The overall concept was strong and impressive, but key features where not included while others where not needed. The overall experience was not tight, and lacked a cohesive visual look & feel.
Rethinking the flows
Together with the product team, we reviewed and tweaked the flows and data presentations to include many more details and personas.
Streamlining the UI
We took the look and feel to the next level - incorporating new modules, iconography, graphs and a far clearer and attractive typography.
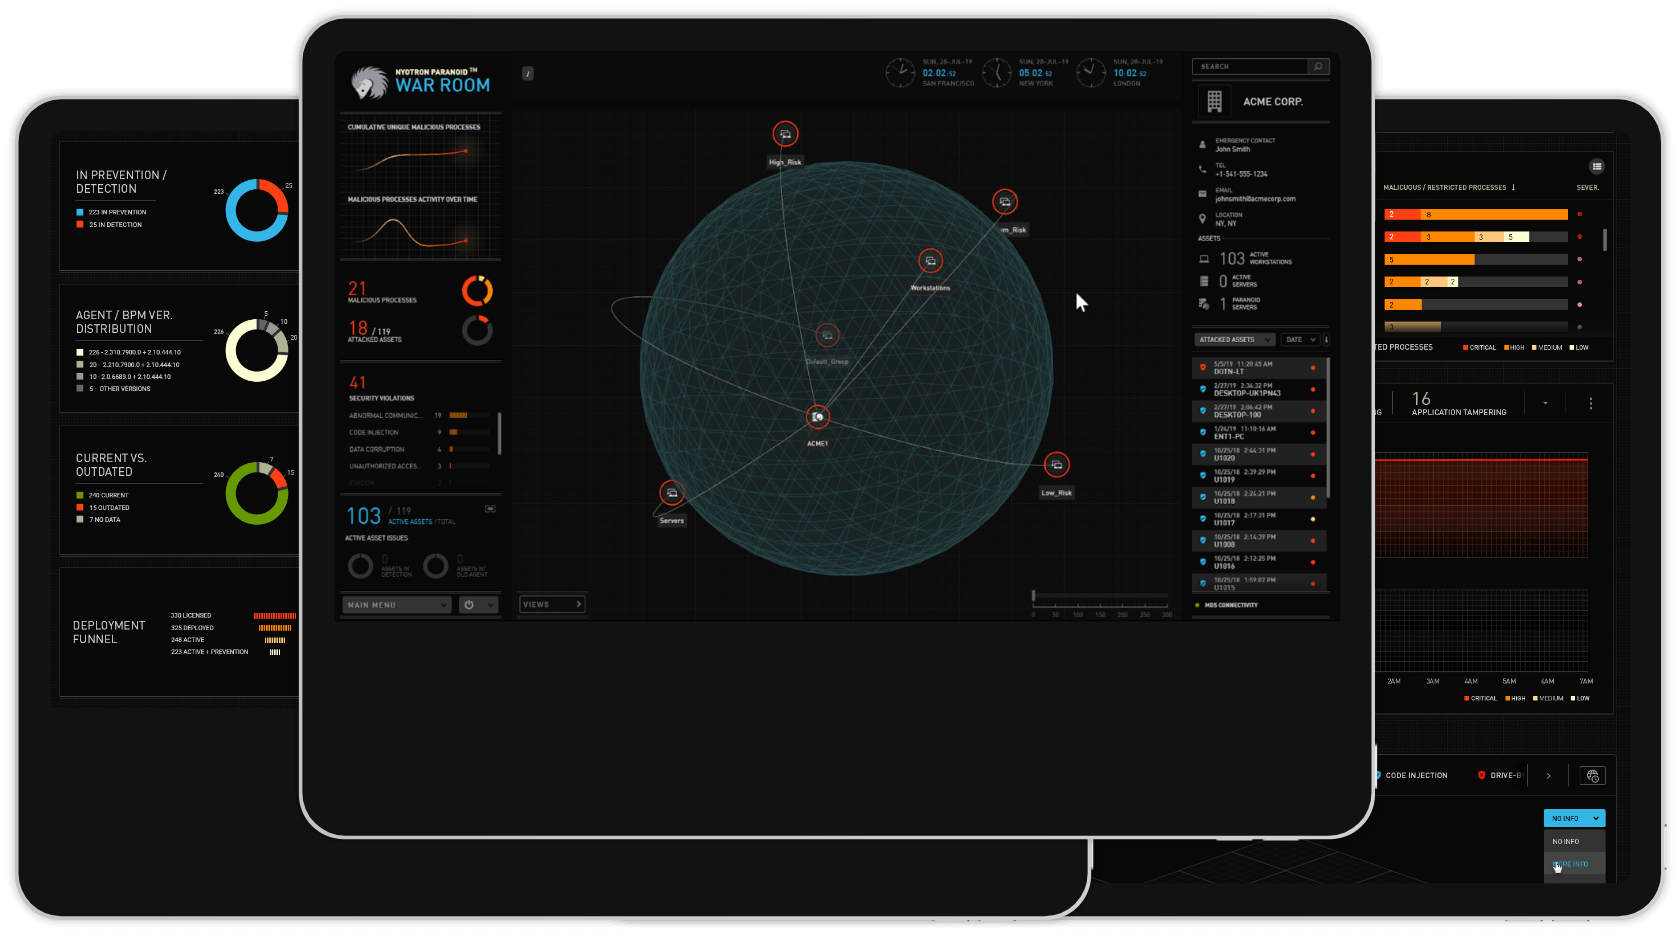
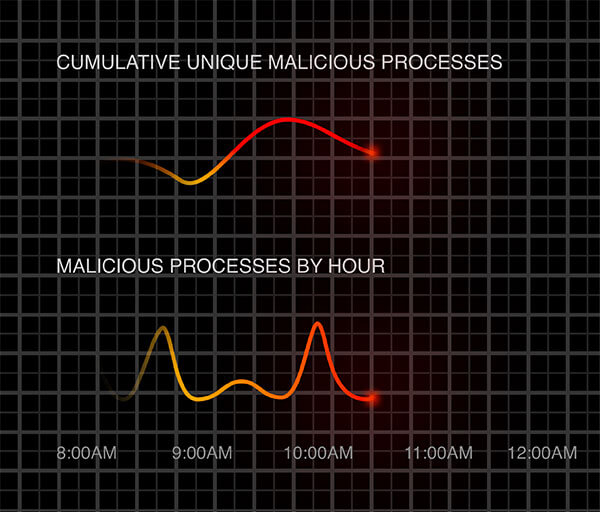
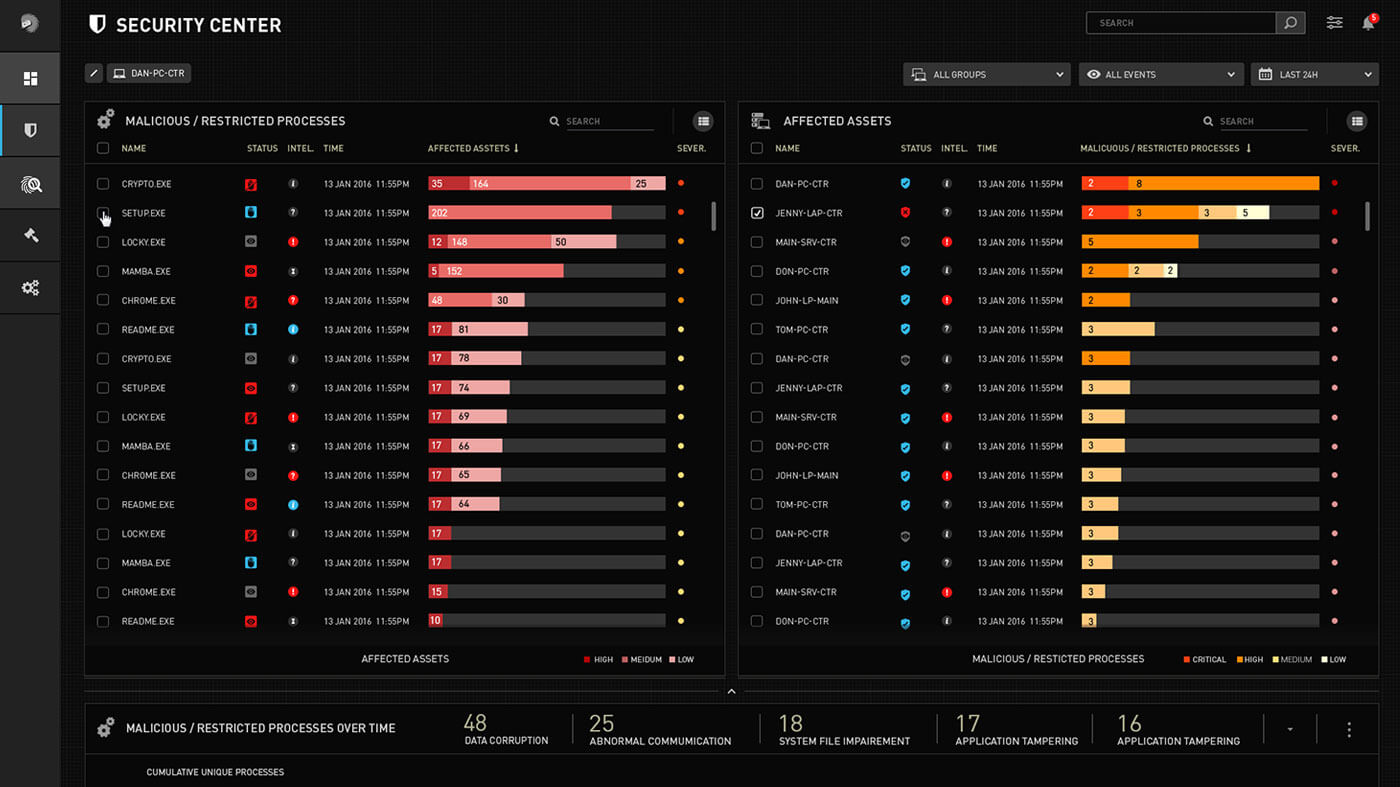
Malicious processes graph
We introduced a new animated ‘AKG’ style graph, that besides being informative, is giving more life and visual appeal.
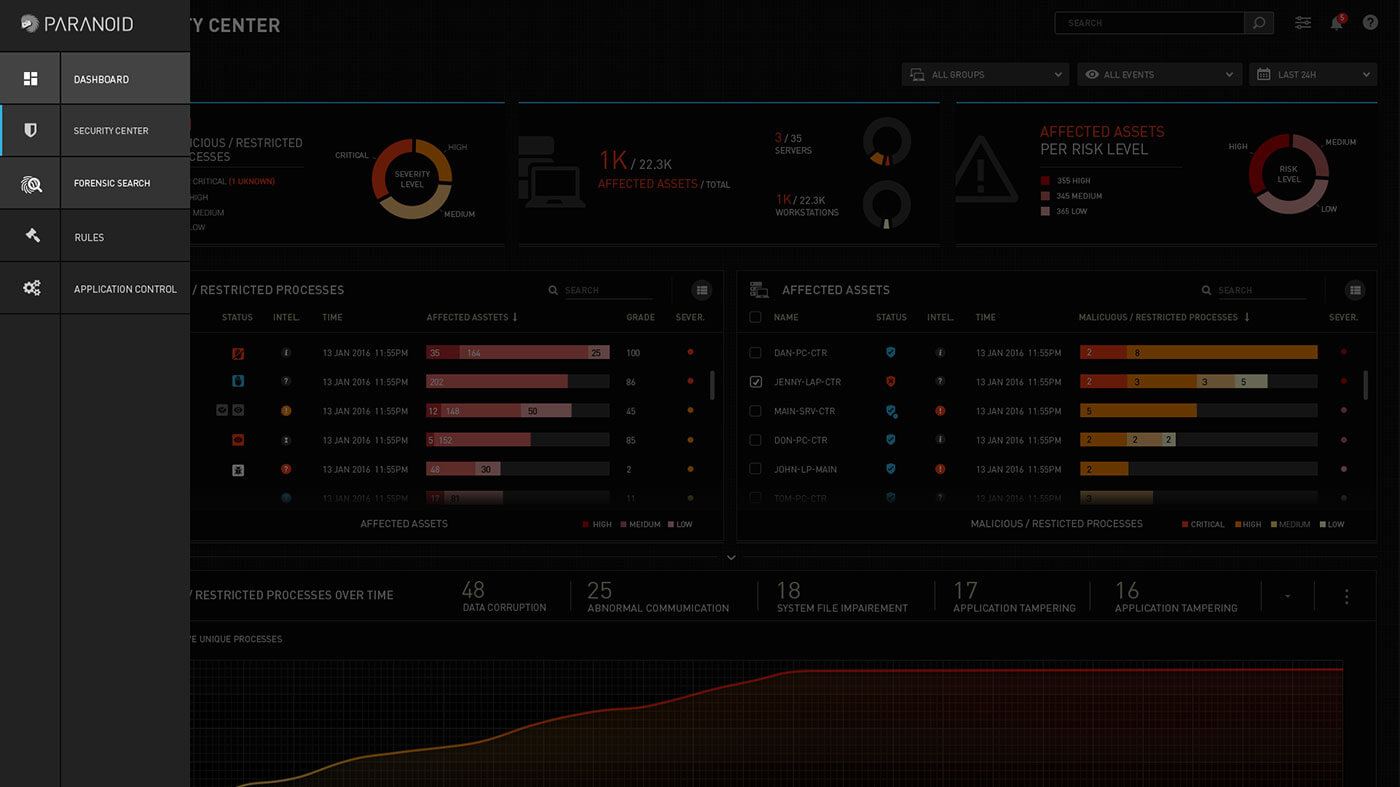
System overview panel
The overview panel was completely redesigned using the new and improved modules and behaviours, so functionality was enhanced and the look and feel became much more attractive and clear.
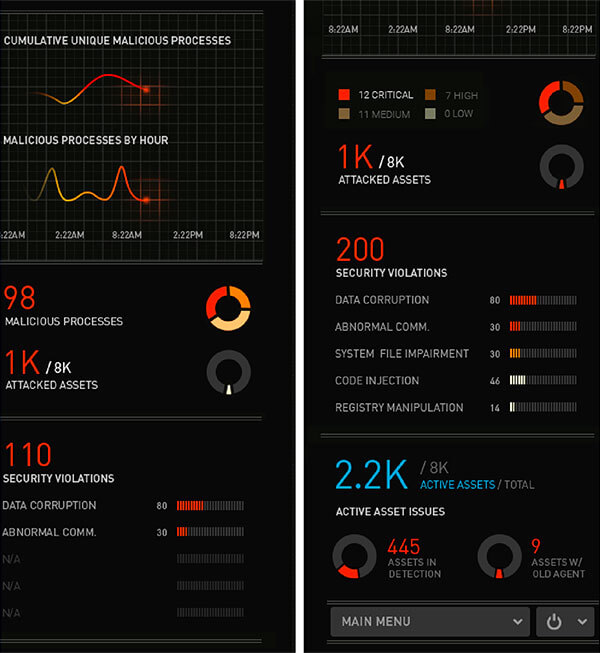
Security violations list
We devised a new way to accumulate violations, by having a list with rows consisting of 25 lines, representing up to 4 violations each.

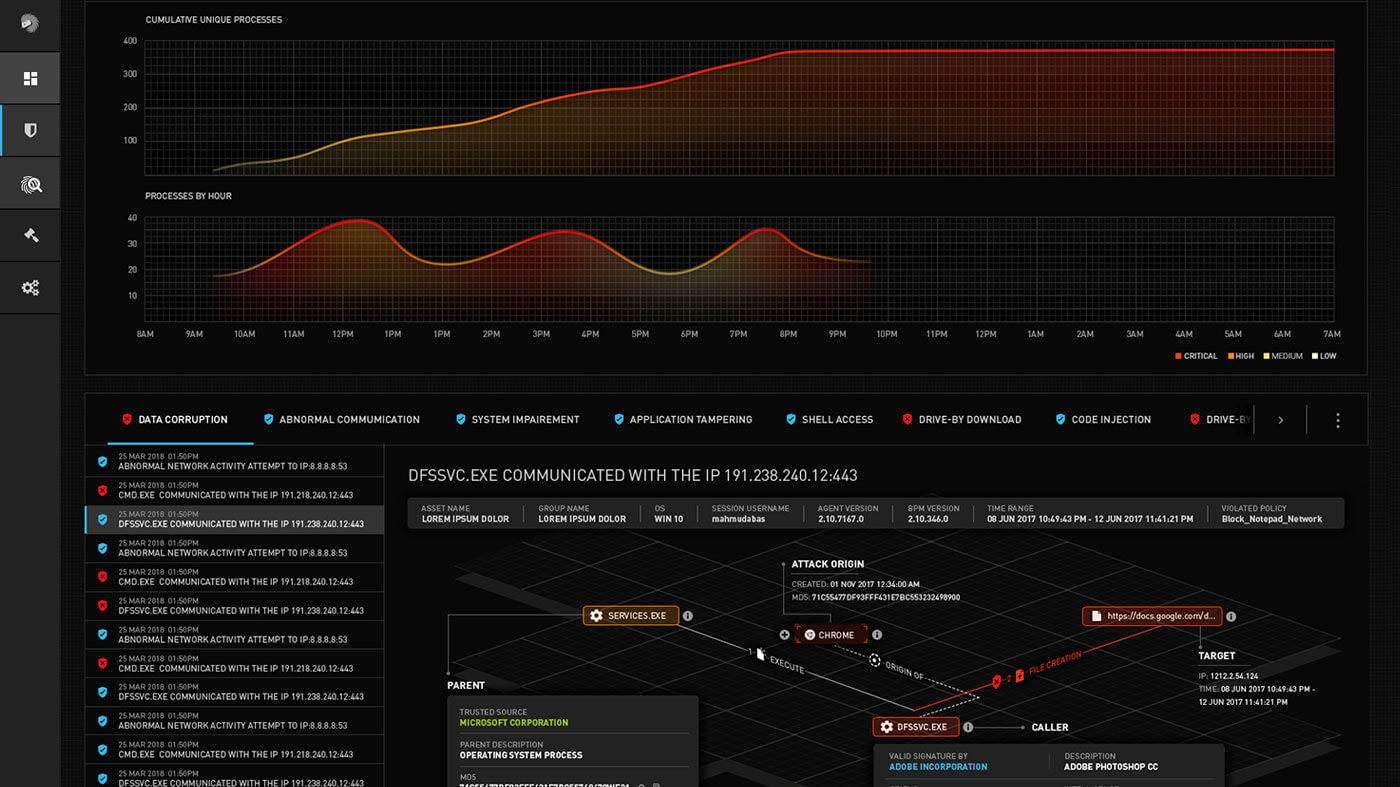
Charts
We streamlines and enhanced the look and behaviour of the charts and added a much bolder typography with a clearer hierarchy.

Nods and actions
The nodes on the globe where refined and aligned to the new look. We introduced new iconography and indicators.

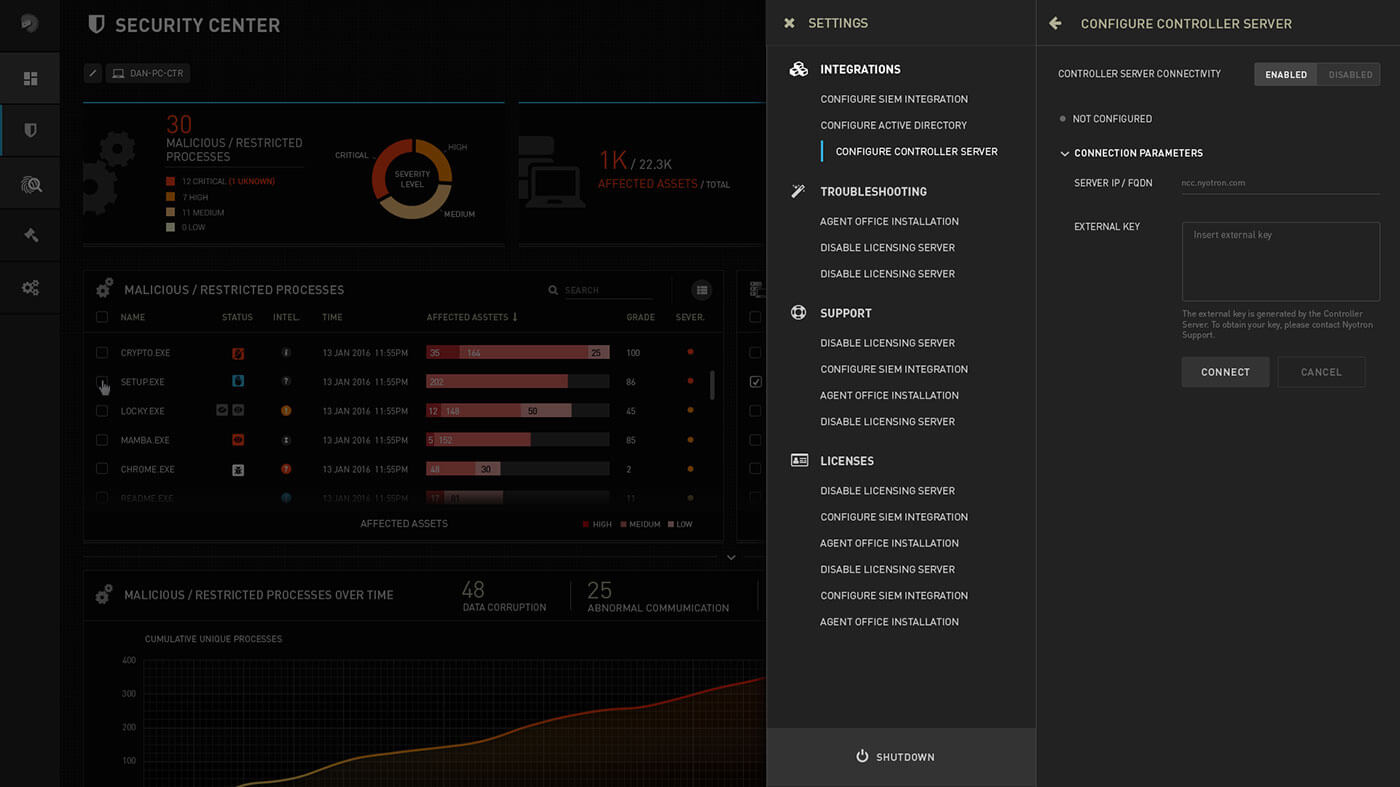
Endpoint panel
We redesigned the endpoint panel so that each endpoint type will have its entire details available. We introduced new modules, font hierarchy and iconography, and revamped the ‘attacked assets’ list
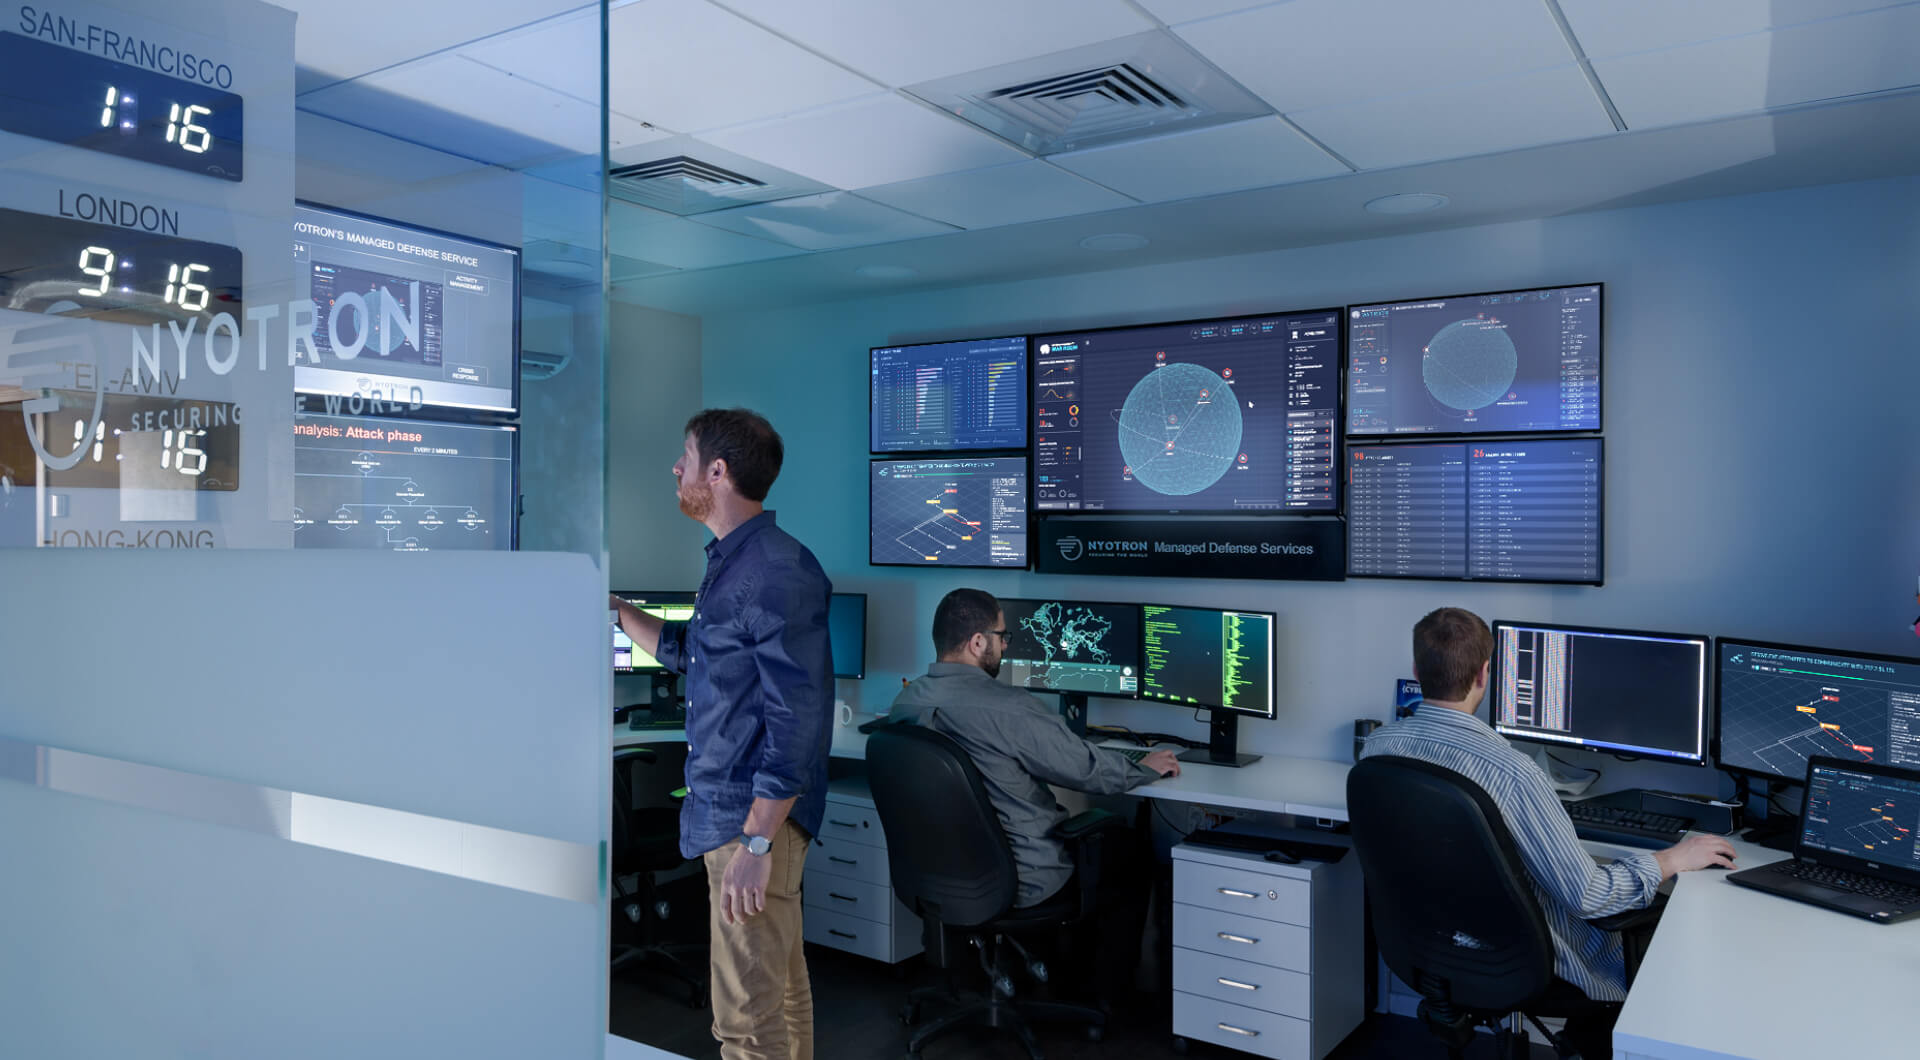
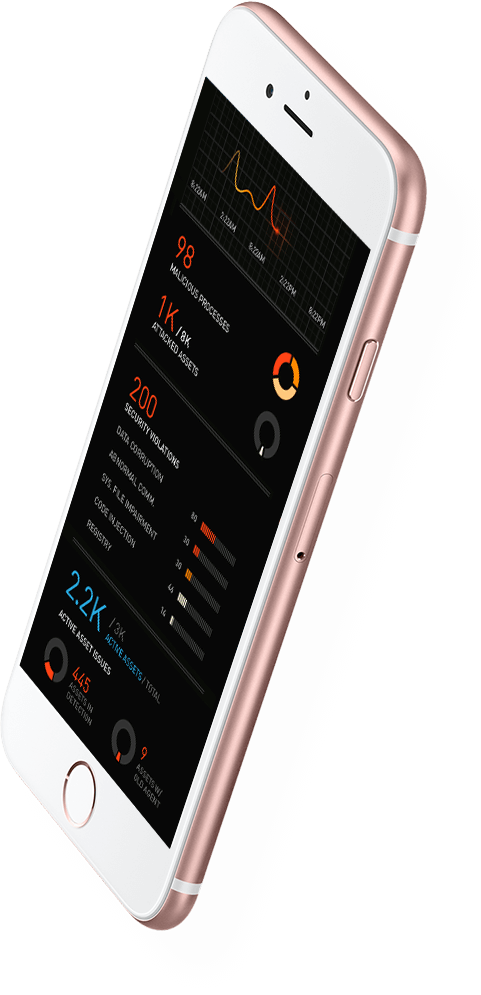
The end result is a brand new War Room - the centrepiece of Nyotron’s products. We continued the process to redesign all of ‘Paranoid’ products under the same style guide and behaviour of the revamped War Room.
Leveraging the design
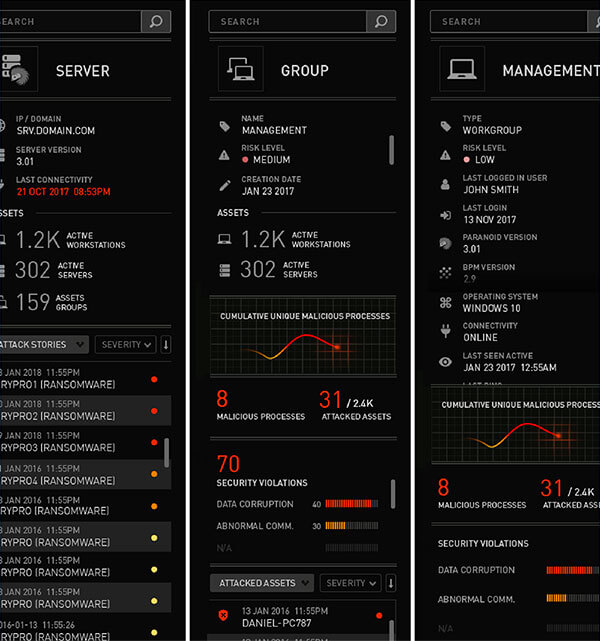
Implementing the visual language of the War Room to the Management Console
The Paranoid Management Console (PMC) offers advanced tools for data analysts to work efficiently. However, its user interface dIdn’t meet the standards required for a seamless integration with the revamped war room.
The logic
The main challenge in designing the PMC was the fact that the user will transfer from a non-scrollable, centric build (the War Room) to a spread-out, data laden scrollable build. The solution was to have the same upper section (incorporating the logo, breadcrumbs and search) while using side and down panels that encapsulate the data in the middle.
 +
+
A non-scrollable centerlized build, with the globe at the center, and data/acttions panels from all sides
 =
=
A spreaded-out build, based on the user scrolling the page, with large differentiated data clusters.

Merging the 2
Encompassing all assets
Creating a consistent visual language to all Nyotron’s products
Completing the design
Nyotron’s ‘Paranoid’ is a feature rich platform with many screens and modules. Each section has been redefined and redesigned to be an integral part of the paranoid package.
Branding & marketing
We streamlined the brand identity including online and offline presence, presentations, marketing collateral and videos.
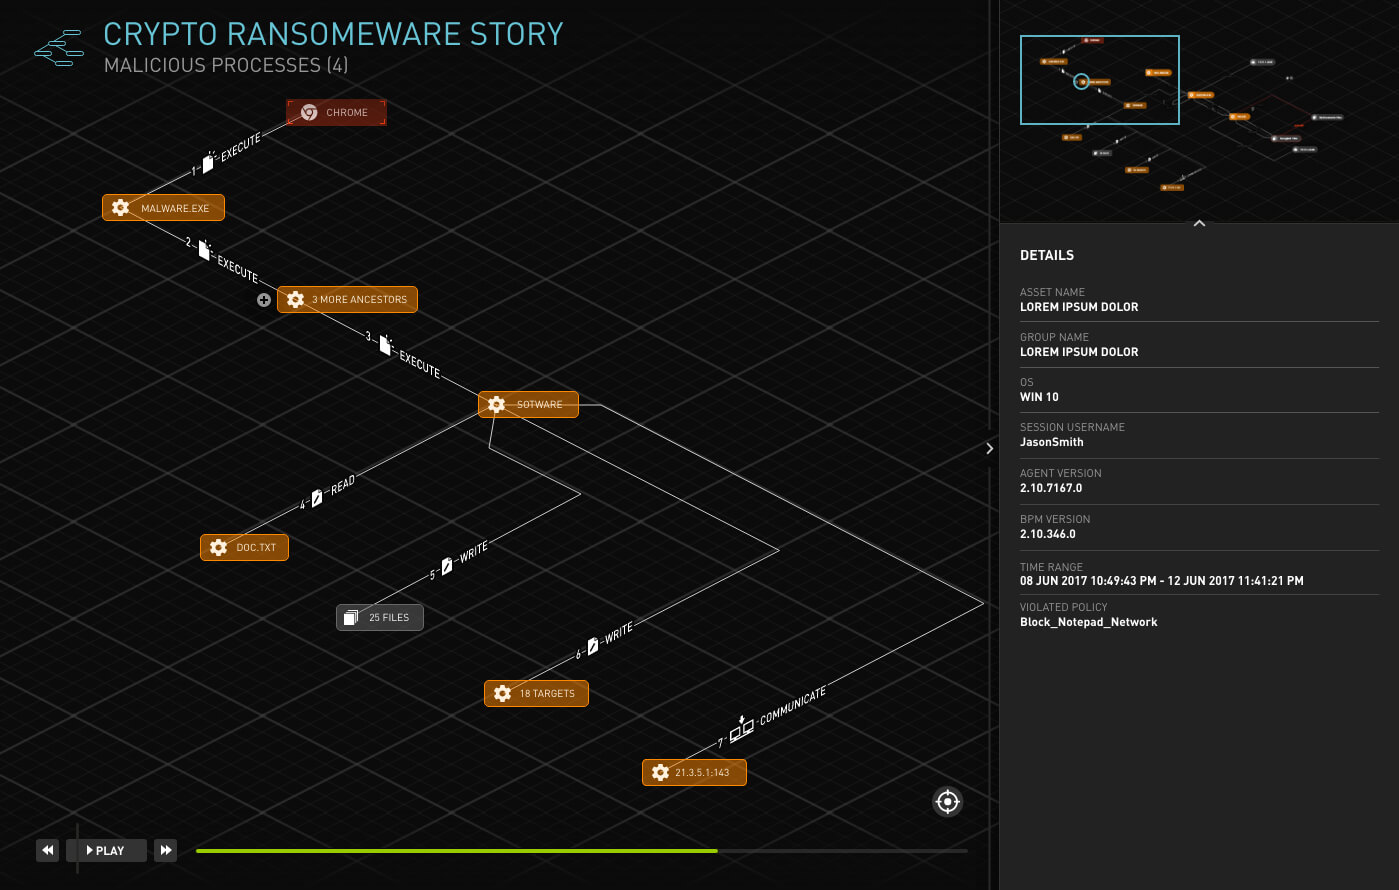
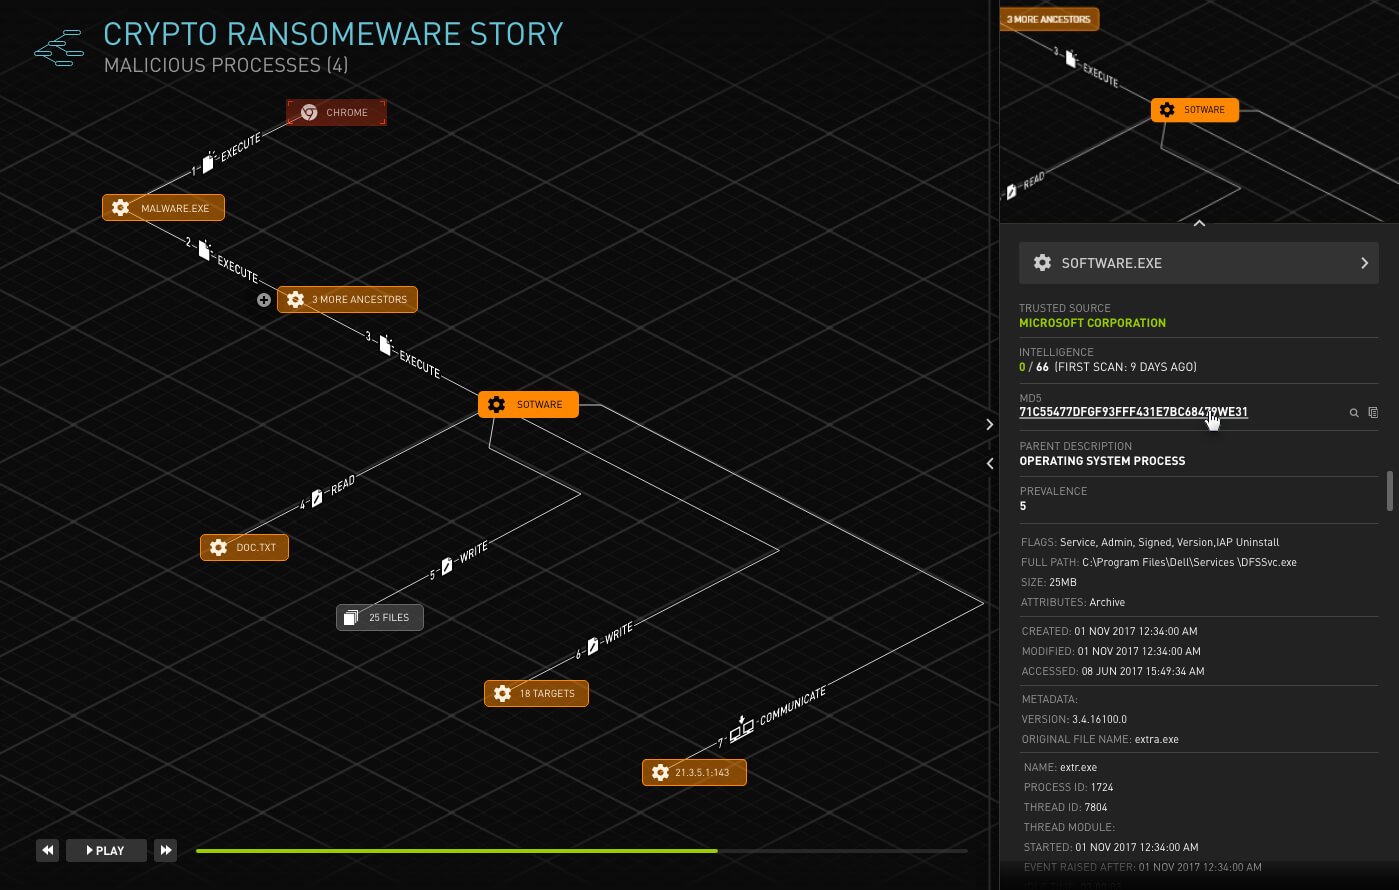
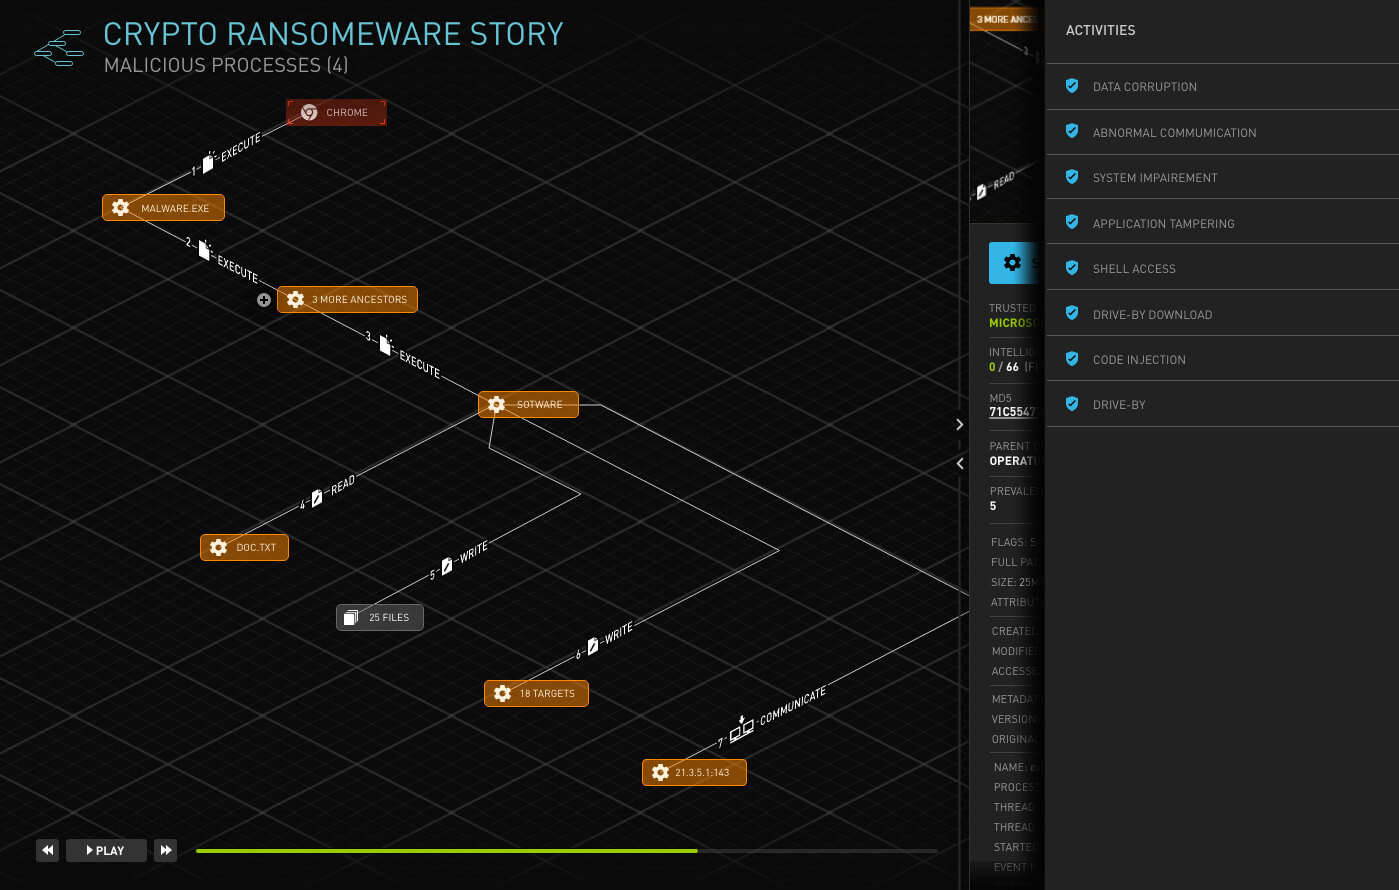
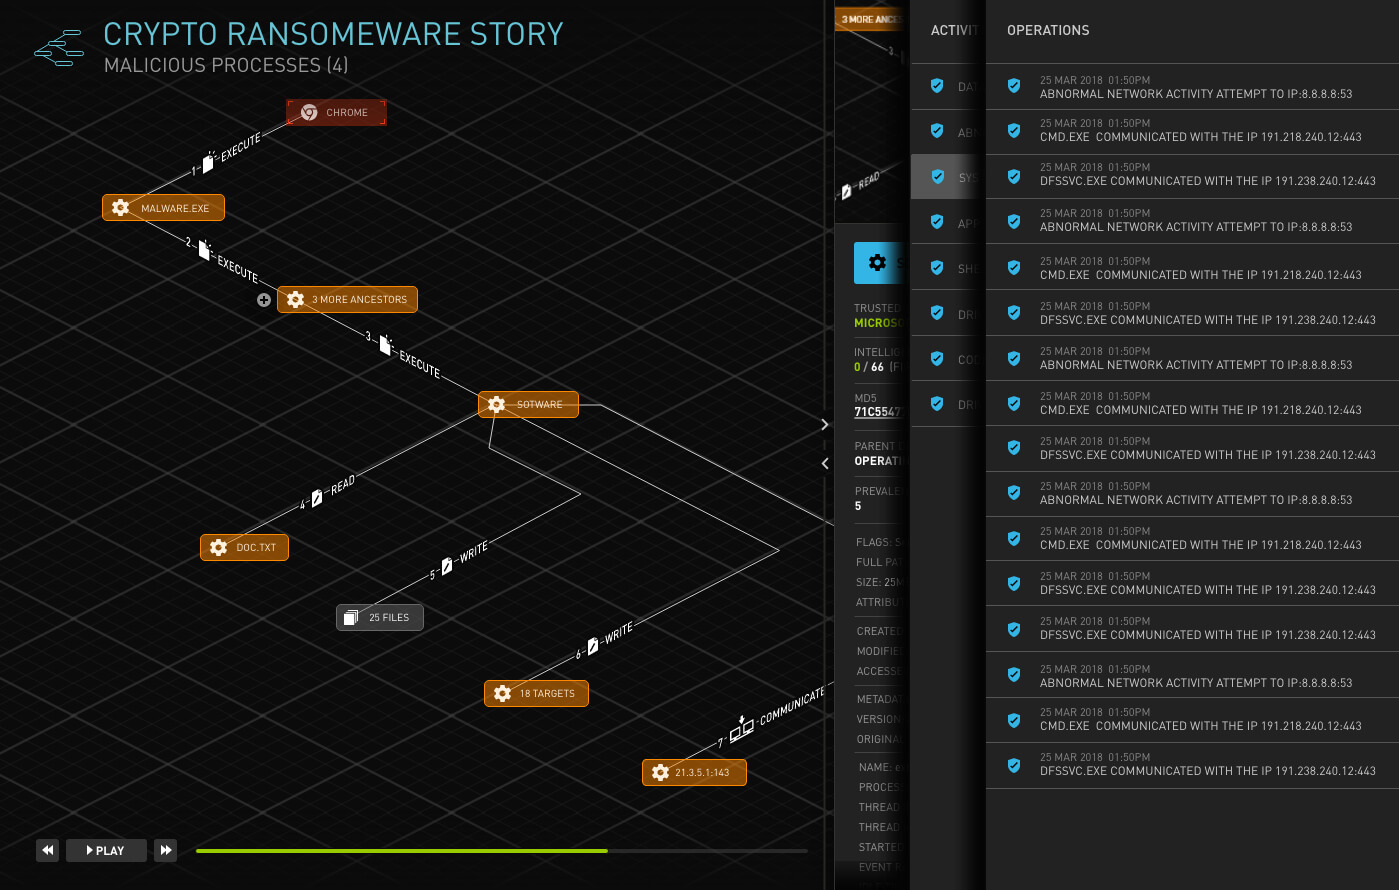
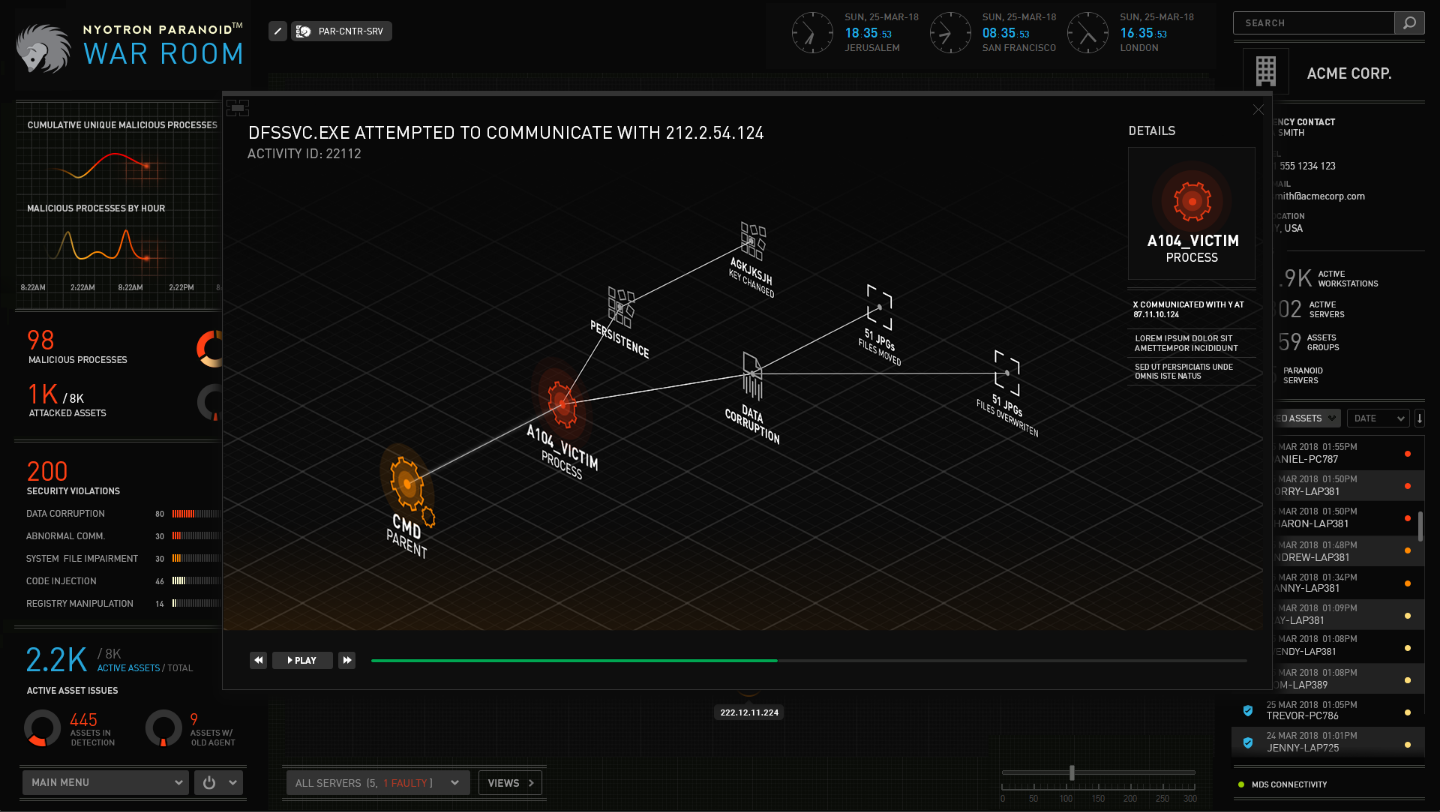
Forensic Search
The forensic search is the main tool in the disposal of the analyst to examine and understand the history of the attack. The ‘story’ is manifested on an isometric path, with each node being clickable and holding stratified content spreaded on consecutive side-panels. The analyst can watch the scenario with an integral player.

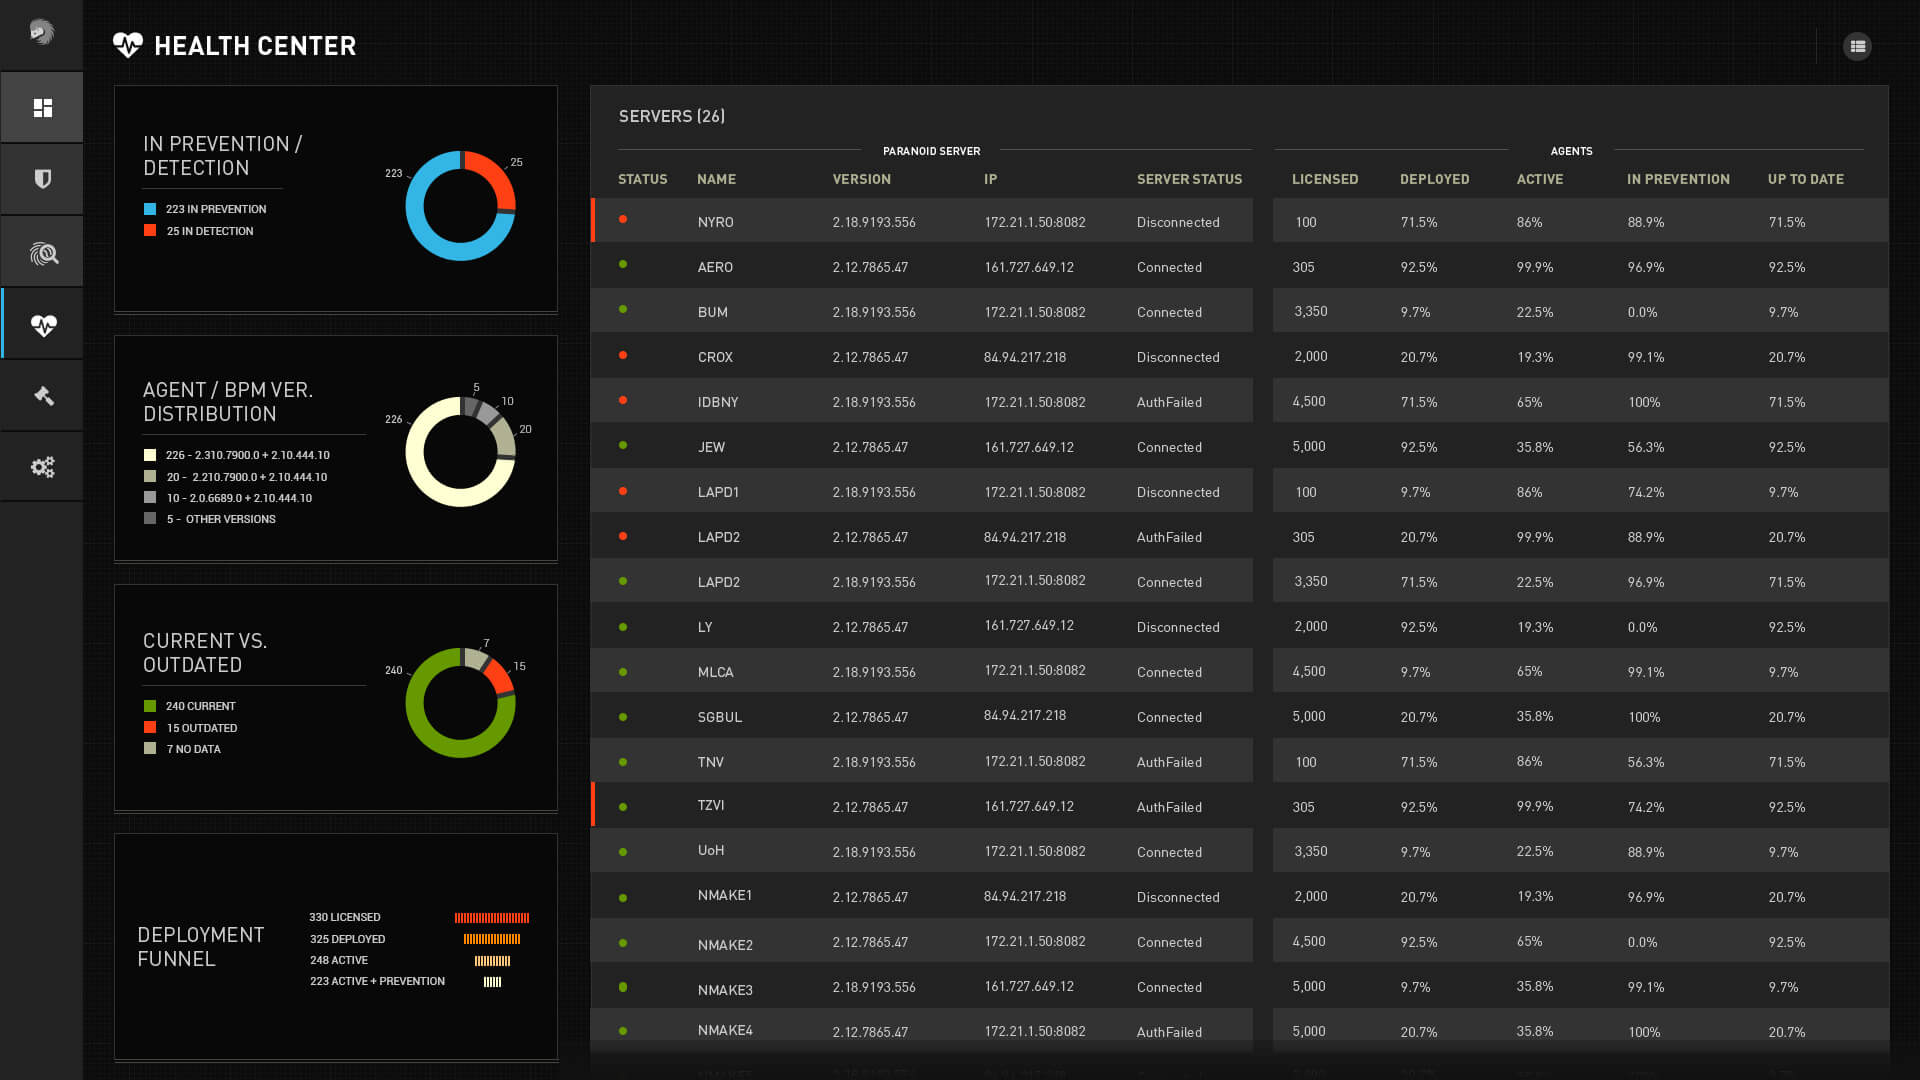
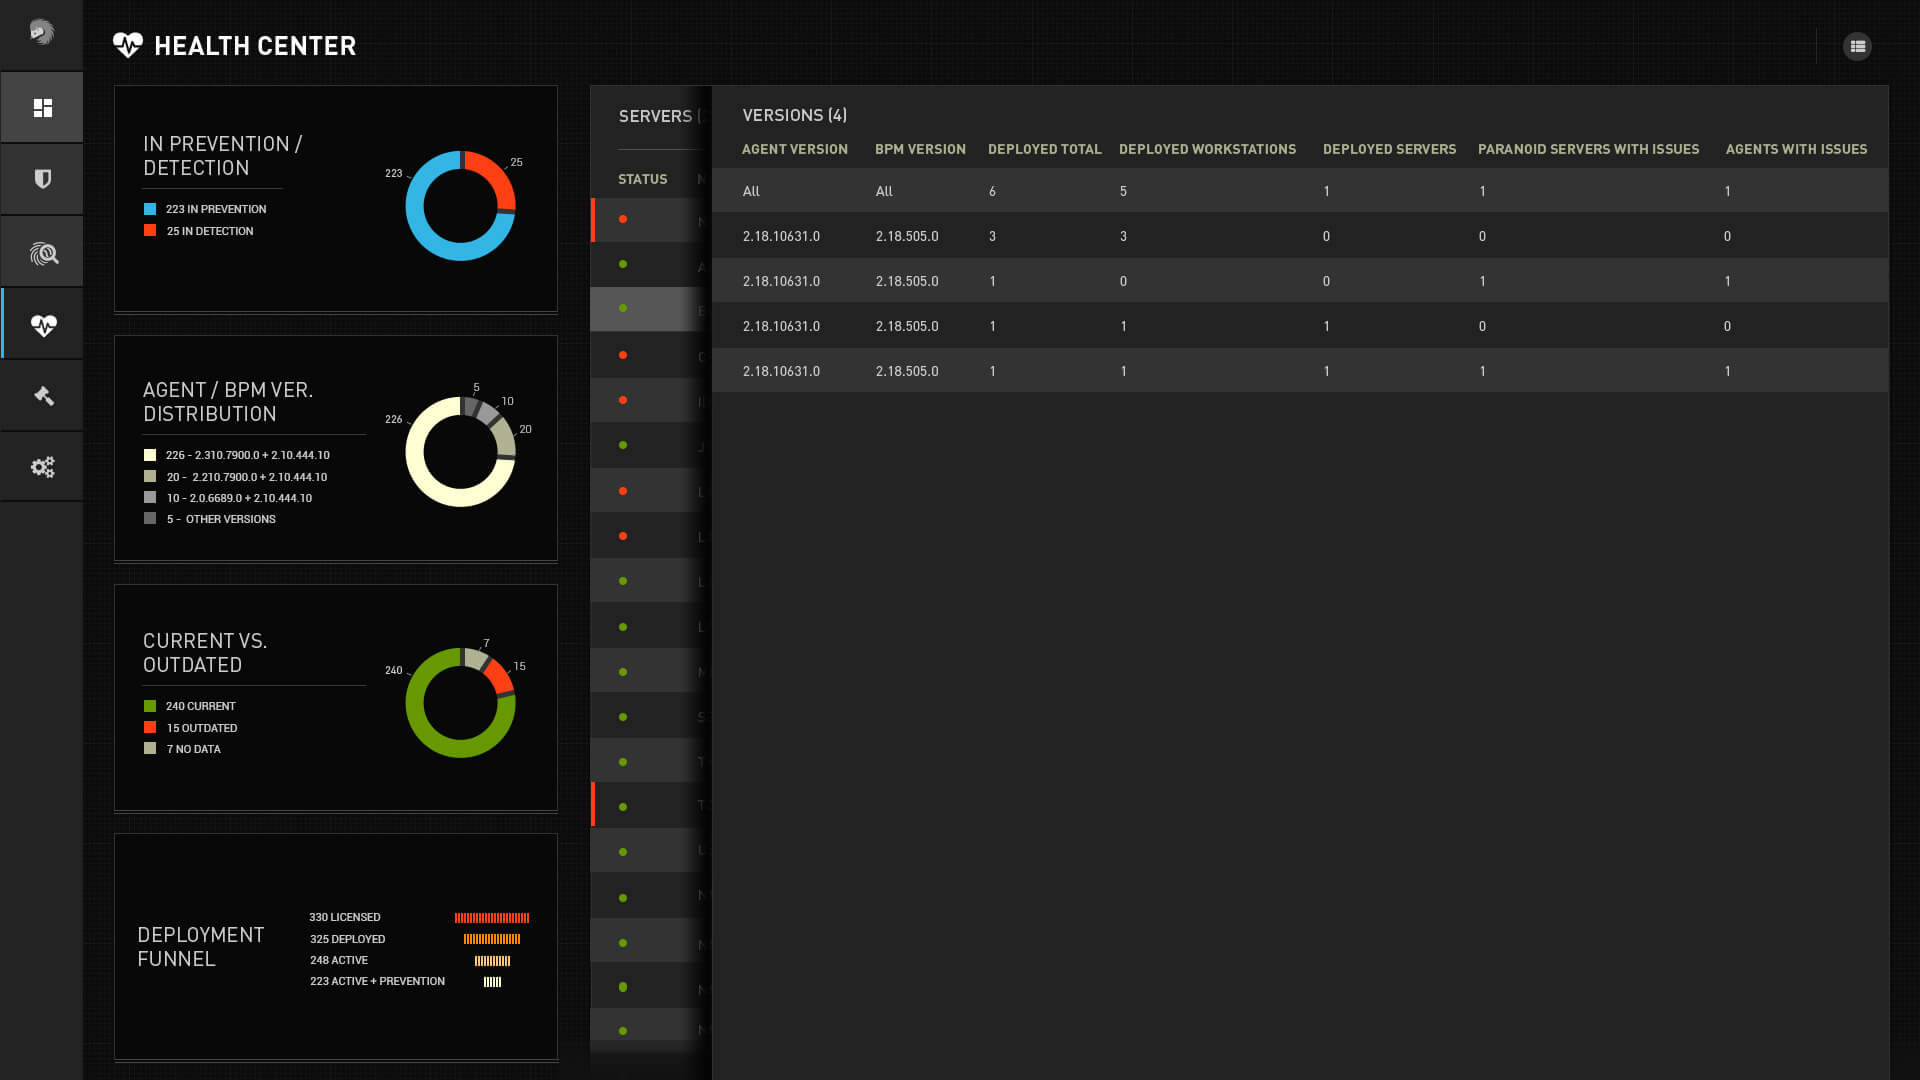
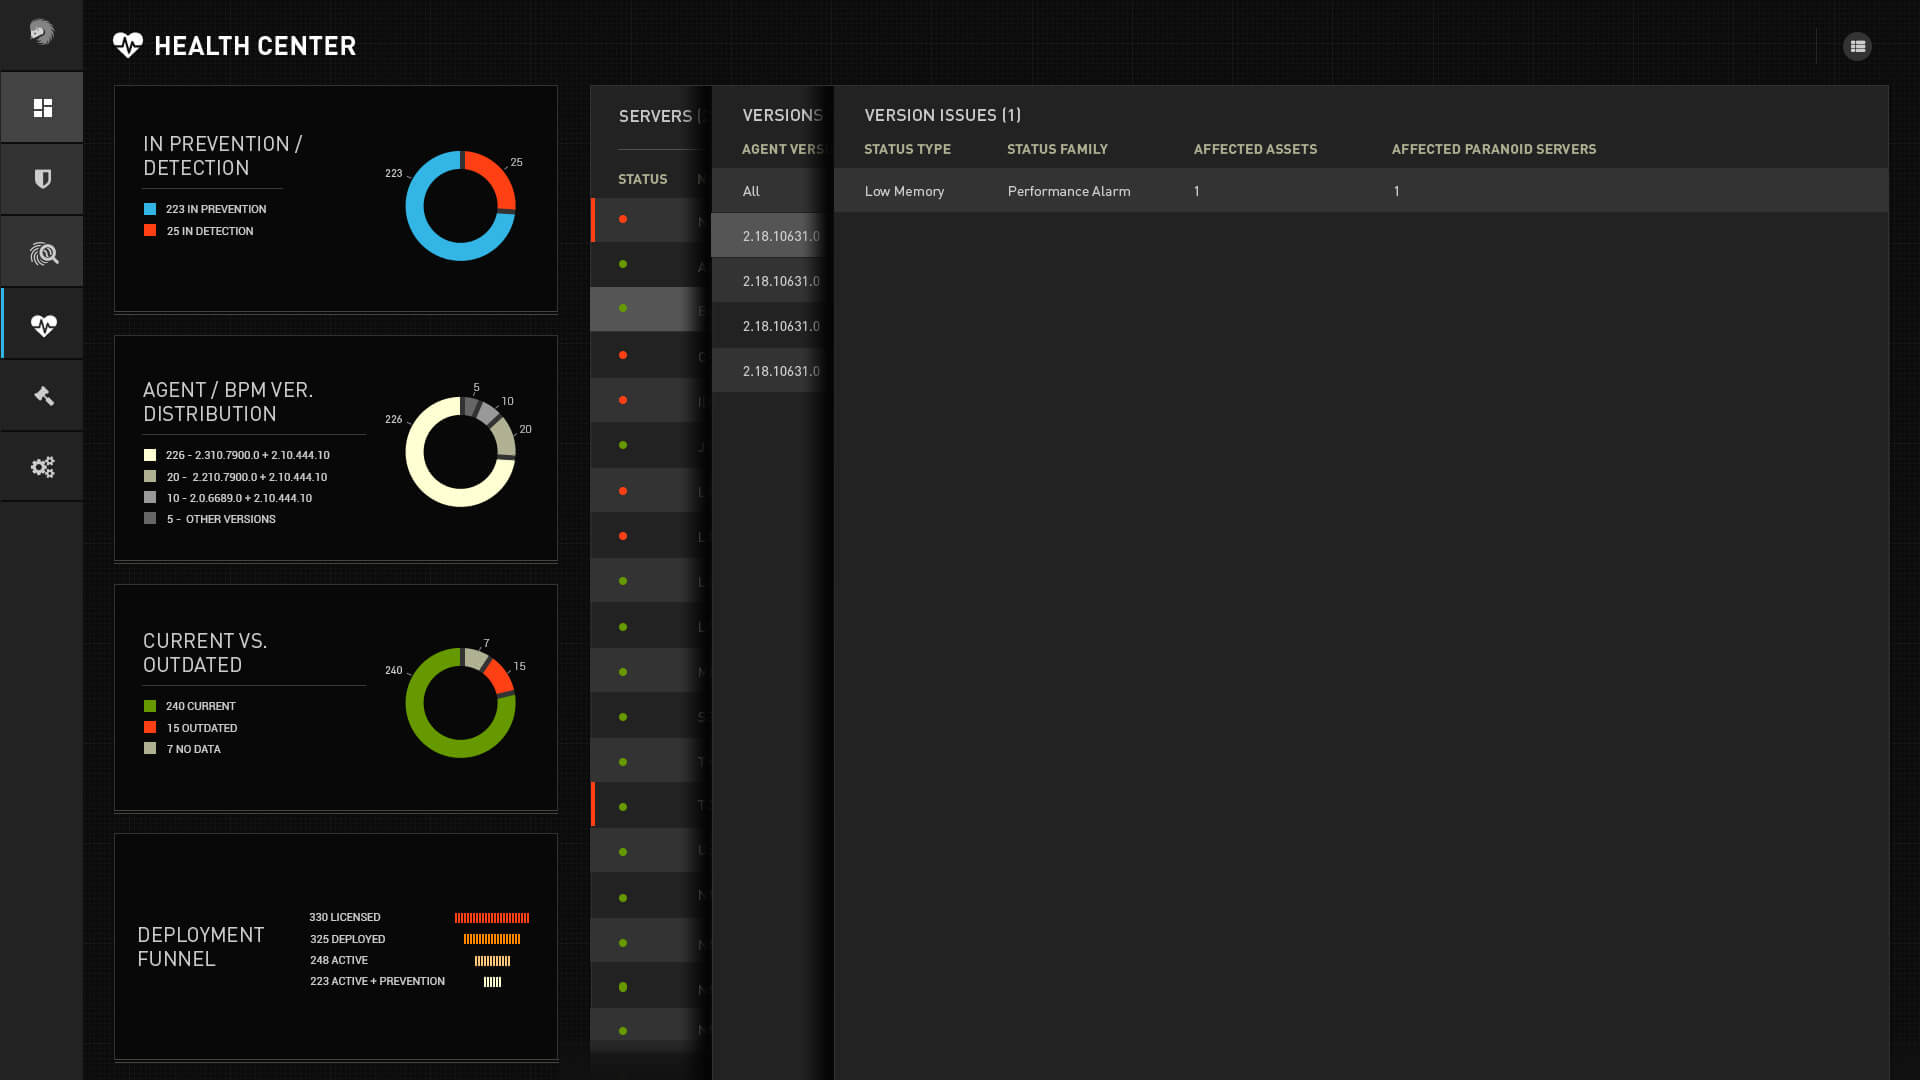
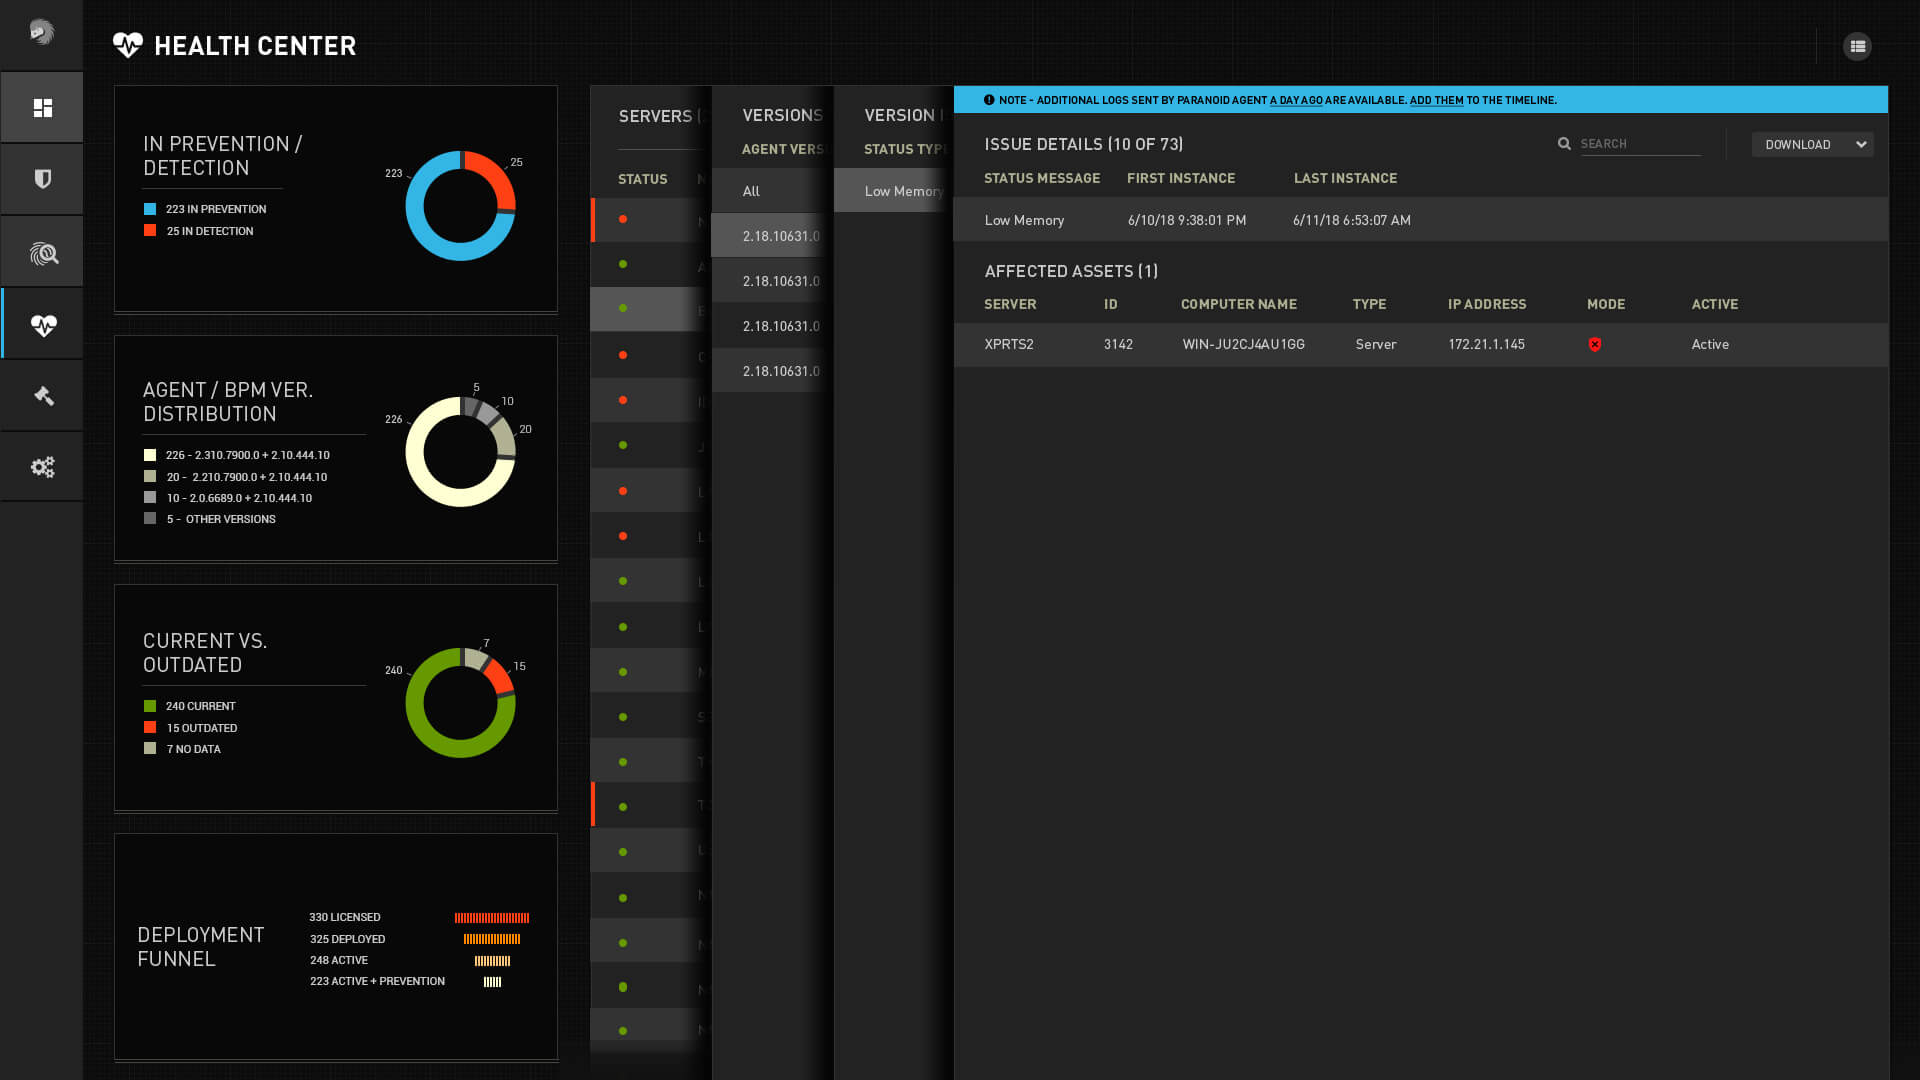
Health Center
The Health Center within the PMC includes a screen presenting visual data and a table detailing the status of paranoid servers and agents. A key feature is the visual drill-down capability, allowing for in-depth analysis directly from the table.
Alternatives
We explored an alternative to thel war room globe: an upward view that spreads the nodes and endpoints. This layout allows for quicker data consumption, but sacrifices the visual movement. IOn the flip side, we investigated a 3D view of the story, which provided more visually exciting presentations but had limitations regarding the amount of data that could be effectively presented.
Marketing etc’
We optimized the brand identity across both online and offline platforms, including presentations, marketing collateral, and videos.